Tagged data-visualization
Projects and posts related to data-visualization.
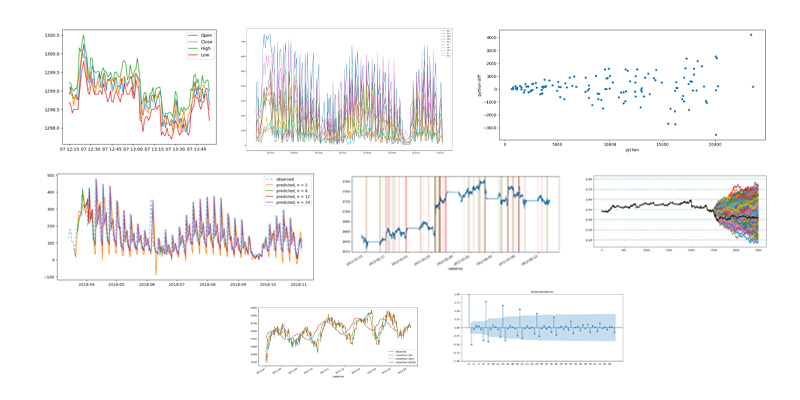
Multi-Dataset Time Series Modeling - Stationarity, Seasonality, and Forecasting Performance
Jun 25, 2024
python data-science data-visualization data-analysis financial-modelling time-series pandas statsmodels forecasting monte-carlo-simA comprehensive comparative study of time series forecasting methods across six diverse datasets (Gold, S&P 500, FTSE, USDC/USDT, StackOverflow questions, and cinema tickets). This analysis evaluates 10+ forecasting techniques—from naive baselines to ARIMA/SARIMA models—with quantitative performance metrics (MSE, RMSE, MAE), explores stationarity testing, seasonality decomposition, Monte Carlo simulation, and implements a simulated trading strategy.
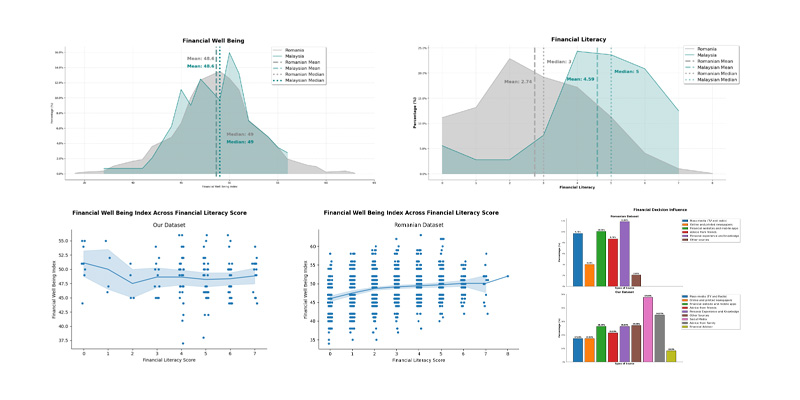
Our Malaysian Dataset (Part 1) - A Cross-Cultural Analysis with Romanian Dataset for Financial Well-Being, Literacy and Behaviour
Nov 01, 2023
python data-visualization data-analysis pandas numpy seaborn matplotlib financeWe compare the Romanian dataset with our own surveyed dataset and explore the relationship between the sociodemographic and financial behaviour, with financial well being and financial literacy.
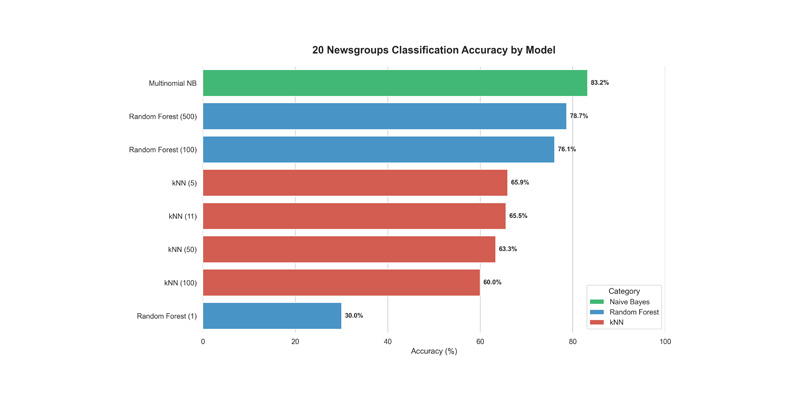
Supervised Learning Benchmarks for Numeric and Textual Data
Sep 18, 2023
machine-learning scikit-learn data-visualization classificationThis project conducts a detailed evaluation of popular machine learning algorithms and their performance characteristics. It benchmarks Naive Bayes, Random Forest, and k Nearest Neighbors across multiple datasets ranging from simple iris data to complex geospatial and text categories. The analysis explores the relationship between hyperparameter tuning and model efficiency while providing quantitative results on accuracy and execution time.